A boiling point diagram is the graphical representation of the relationship between the alcohol strength in the liquid, the alcohol strength in the vapor or in the current distillate, and the boiling liquid or vapor temperature.
The temperature of the boiler and the boiling temperature of the liquid are identical, at least directly above the liquid surface. However, the alcohol strengths of the liquid and the vapor differ. This is the reason for the increased concentration of alcohol during distillation. Two-dimensional representation thus results in three curves: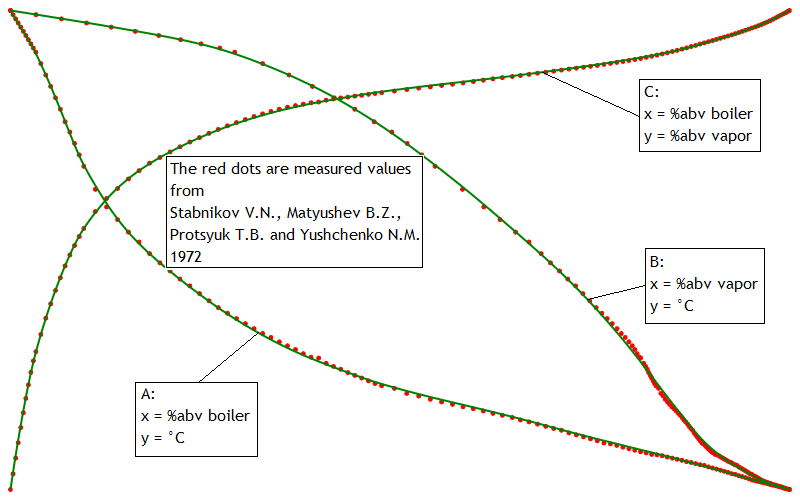 The smoothing of the data:
In this process, one can stay very close to the original or move very far away. Ideally, this depends on what background information is available and, above all, how the measurement data originated.
All we know is that these data are often cited by scientific publications and that they have by far the most data points compared to other sources. There are 125 measurements, so 125 times mole fraction ethanol in the boiler, boiling temperature and mole fraction ethanol in the distillate.
A comparison with computer simulations like Aspen Plus was disappointing. So either the measured data is extremely poor or you can't calculate a boiling point diagram as accurately as you can measure it. In any case, we think that such large errors cannot happen in the measurements, which would be necessary to come to the values of Aspen, and therefore we stick to the measured values.
It may look strange in some places how the green line deviates from the measured data. In the middle of curve A for example. The reason there is the strange waveform of the original data in the lower right corner of curve B. If you correct this, the other two curves change as well, since everything is related. When smoothing this wave, we tried to distribute the inevitable deviation evenly over the other two curves. However, it cannot be ruled out that this wave is correct, i.e. that it is a mistake to smooth it.
The azeotrope of ethanol and water is most likely 97.2%abv and 78.17°C at normal atmospheric pressure 1013.25 hPa. That's 95.60%abw and 89.48%abm.
Rectification:
Distillation with rectification results in a higher concentration of alcohol than is evident from the boiling point diagram data. The curve C is therefore distorted. It rises faster from left to right and is then less steep further to the right. However, it is not possible to get higher than the azeotrope even with rectification.
With rectification, however, the vapor temperature at the highest point of the still, i.e. after rectification, is no longer identical with the temperature in the liquid or directly above the liquid. The relationship between the alcohol strength in the liquid and the boiling temperature and the relationship between the alcohol strength in the vapor and its temperature, however, both remain the same. Curve A and B therefore do not change, in contrast to curve C.
The influence of the atmospheric pressure:
A decrease in pressure causes lower boiling or vapor temperatures and an increase in azeotrope:
If you get the atmospheric pressure from weather services instead, it is almost always the mean sea-level pressure, since only this is meaningful for the weather situation. If it is not possible to find out the absolute air pressure, our tool Elevation - Atmospheric Pressure can calculate it.
We have incorporated both the pressure dependence of the alcohol strength of the azeotrope and that of the temperatures into our calculators. But the further one gets away from normal atmospheric pressure, the more uncertain the computational results are, because the data are very thin. We have taken the alcohol strength of the azeotrope as a function of pressure from this diagram: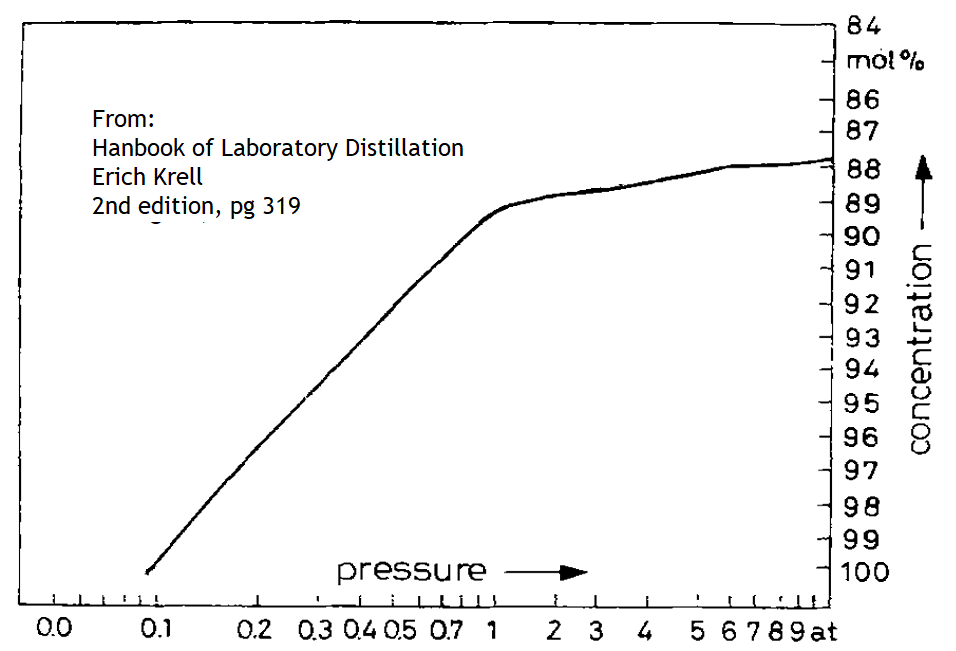 The temperatures of the boiling points as a function of atmospheric pressure are calculated with formulas according to Frost/Kalkwarf/Miller.
The temperature of the boiler and the boiling temperature of the liquid are identical, at least directly above the liquid surface. However, the alcohol strengths of the liquid and the vapor differ. This is the reason for the increased concentration of alcohol during distillation. Two-dimensional representation thus results in three curves:
- The relationship of the alcohol strength in the liquid to the boiling temperature.
- The relationship of the alcohol strength in the vapor to the vapor temperature.
- The relationship of the two alcohol strengths to each other.
In this process, one can stay very close to the original or move very far away. Ideally, this depends on what background information is available and, above all, how the measurement data originated.
- What did the distillation apparatus look like?
- How the alcohol content was measured? By density (alkoholmeter or pycnometer) or by refractive index (refractometer)? If refractometer, how was the problem of refractive index solved at high alcohol strengths, by dilution for example? What formulas or data were used to determine alcohol strength from density or refractive index?
- What data or formulas were used to prepare the alcohol strengths for the boiler?
All we know is that these data are often cited by scientific publications and that they have by far the most data points compared to other sources. There are 125 measurements, so 125 times mole fraction ethanol in the boiler, boiling temperature and mole fraction ethanol in the distillate.
A comparison with computer simulations like Aspen Plus was disappointing. So either the measured data is extremely poor or you can't calculate a boiling point diagram as accurately as you can measure it. In any case, we think that such large errors cannot happen in the measurements, which would be necessary to come to the values of Aspen, and therefore we stick to the measured values.
It may look strange in some places how the green line deviates from the measured data. In the middle of curve A for example. The reason there is the strange waveform of the original data in the lower right corner of curve B. If you correct this, the other two curves change as well, since everything is related. When smoothing this wave, we tried to distribute the inevitable deviation evenly over the other two curves. However, it cannot be ruled out that this wave is correct, i.e. that it is a mistake to smooth it.
The azeotrope of ethanol and water is most likely 97.2%abv and 78.17°C at normal atmospheric pressure 1013.25 hPa. That's 95.60%abw and 89.48%abm.
Rectification:
Distillation with rectification results in a higher concentration of alcohol than is evident from the boiling point diagram data. The curve C is therefore distorted. It rises faster from left to right and is then less steep further to the right. However, it is not possible to get higher than the azeotrope even with rectification.
With rectification, however, the vapor temperature at the highest point of the still, i.e. after rectification, is no longer identical with the temperature in the liquid or directly above the liquid. The relationship between the alcohol strength in the liquid and the boiling temperature and the relationship between the alcohol strength in the vapor and its temperature, however, both remain the same. Curve A and B therefore do not change, in contrast to curve C.
The influence of the atmospheric pressure:
A decrease in pressure causes lower boiling or vapor temperatures and an increase in azeotrope:
- However, the increase in azeotrope makes very little difference in the normal atmospheric pressure range. A noticeable increase is only possible with a vacuum distillation or a distillation with an artificially induced very strong negative pressure. Then, however, it is even possible to make the azeotrope disappear, i.e. to distill 100% ethanol.
- Temperatures, on the other hand, are very sensitive to temperature. This makes it necessary to take the atmospheric pressure into account even in a normal distillation without negative pressure if one wants to infer alcohol strengths from temperatures.
- For every 100m above sea level, the vapor temperature drops by about 0.3°C.
- The atmospheric pressure varies by about 60 hPa depending on the weather. This causes a temperature range of the boiling points of about 1.6°C. So even if you always distill at the same place, you can't rely on the thermometer without knowing the actual atmospheric pressure. The pressure dependence of the boiling point is somewhat smaller for strong alcohol solutions than for weak ones.
If you get the atmospheric pressure from weather services instead, it is almost always the mean sea-level pressure, since only this is meaningful for the weather situation. If it is not possible to find out the absolute air pressure, our tool Elevation - Atmospheric Pressure can calculate it.
We have incorporated both the pressure dependence of the alcohol strength of the azeotrope and that of the temperatures into our calculators. But the further one gets away from normal atmospheric pressure, the more uncertain the computational results are, because the data are very thin. We have taken the alcohol strength of the azeotrope as a function of pressure from this diagram: