Creates an interactive downloadable boiling point diagram taking into account atmospheric pressure and theoretical plates.
theoretical plates (1-50)
hPa local atmospheric pressure (75-10000)
Thermometer error
hPa local atmospheric pressure (75-10000)
Thermometer error
%abv and in the boiler
%abv and in the vapor
%abv and in the vapor
When calculating only one theoretical plate, you get an ordinary VLE-diagram with the boiling and dew curves, the two alcohol strengths readable on the x-axis and the temperature on the y-axis.
One reads off then in such a way:
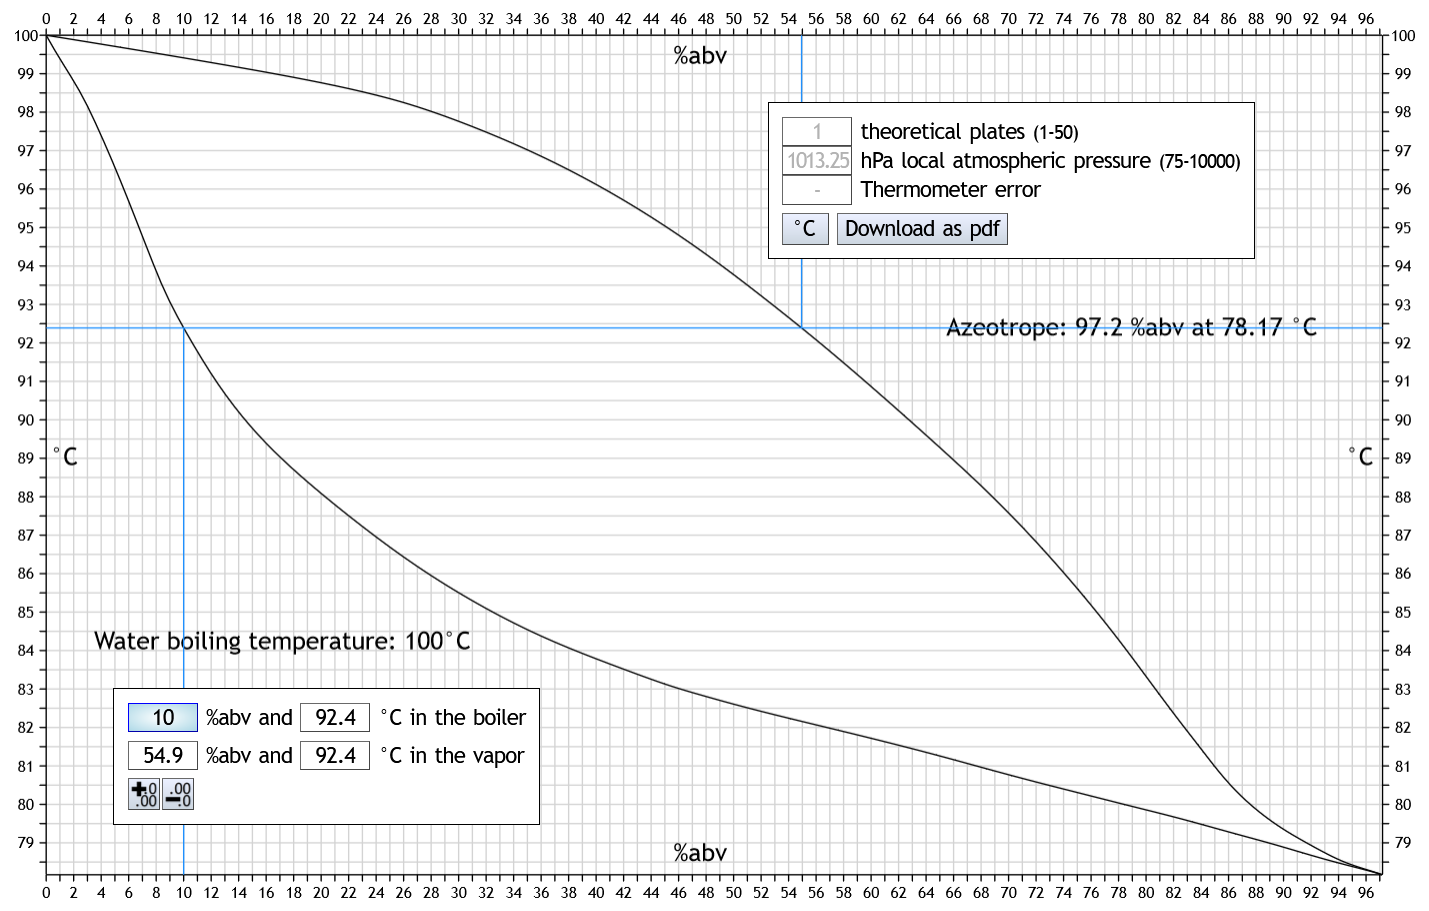 On the lower left is the alcohol strength in the boiler, i.e. 10%abv, on the left is the temperature in the boiler, i.e. 92.4°C, on the right is the vapor temperature, also 92.4°C, since it is only a theoretical plate, and on the upper right is the alcohol strength in the distillate, i.e. 54.9%abv.
These blue lines are displayed when you move the cursor over one of the axis lines. The corresponding numerical values are displayed in the field at the bottom left.
It also works the other way around: If you enter a value, the other three are calculated and the corresponding blue lines are drawn.
With more than one theoretical plate, such a diagram is not usable. This is because then you get a higher alcohol strength in the distillate and the vapor temperature is lower than the boiler temperature. This calculator solves this by drawing slanted lines instead of horizontal ones between the two curves. These lines are colored only for better visibility: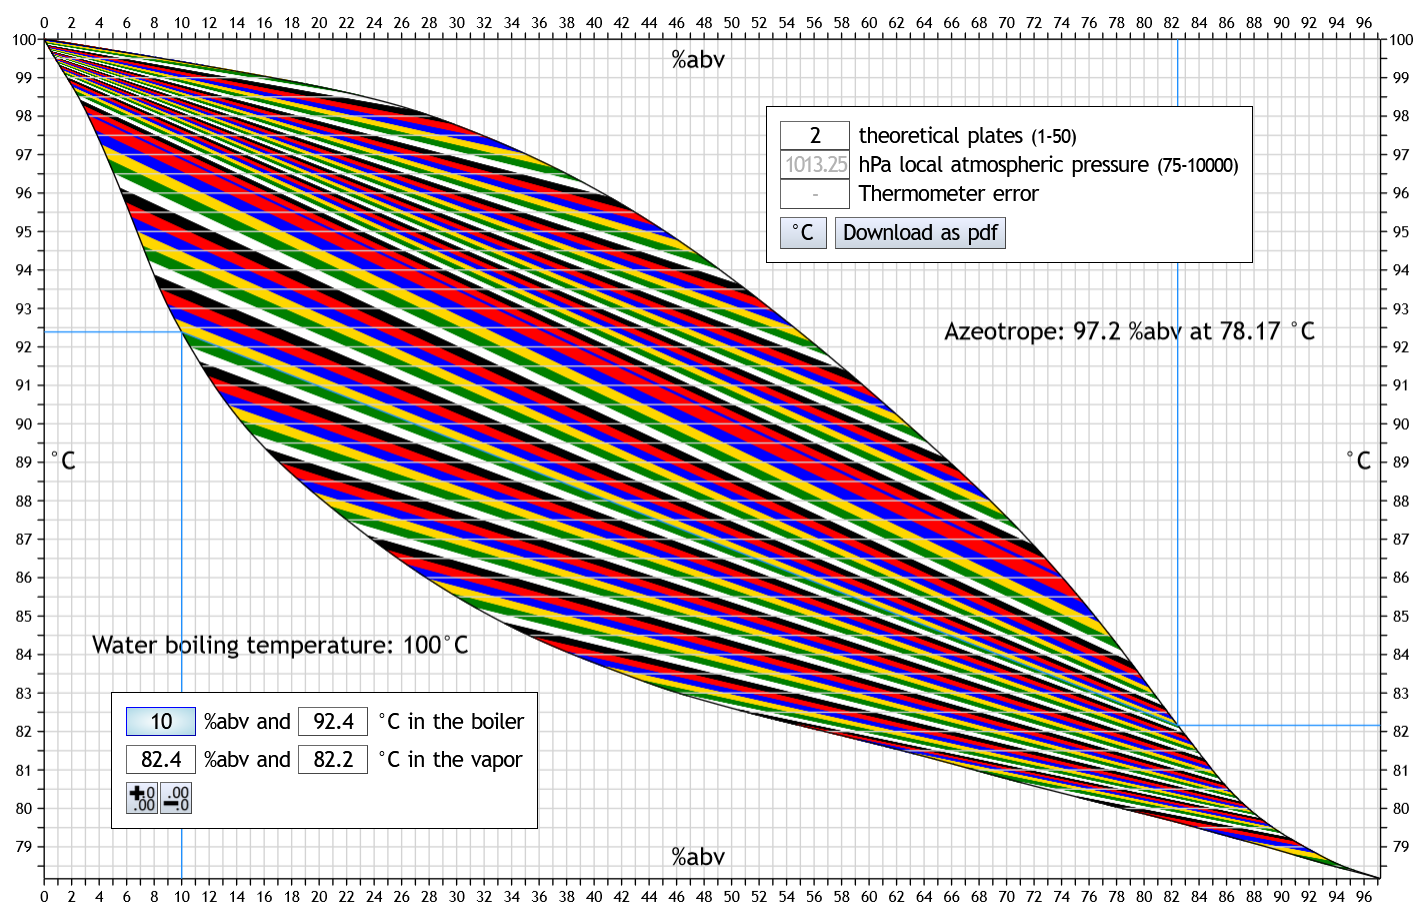 The line between the curves now does not go from the left horizontally to the right, but it follows the colored lines diagonally down to the right and ends up at 82.2°C and 82.4%abv in the vapor and distillate, respectively.
The more theoretical plates, the more slanted the lines.
The line between the curves now does not go from the left horizontally to the right, but it follows the colored lines diagonally down to the right and ends up at 82.2°C and 82.4%abv in the vapor and distillate, respectively.
The more theoretical plates, the more slanted the lines.
A few details can be made visible very well with this calculator:
For example, that at high rectification it doesn't really matter how much alcohol you have in the boiler. At least in terms of the %abv reached in the distillate. Here are 10 theoretical plates. 50%abv in the boiler gives 95.8%abv in the distillate: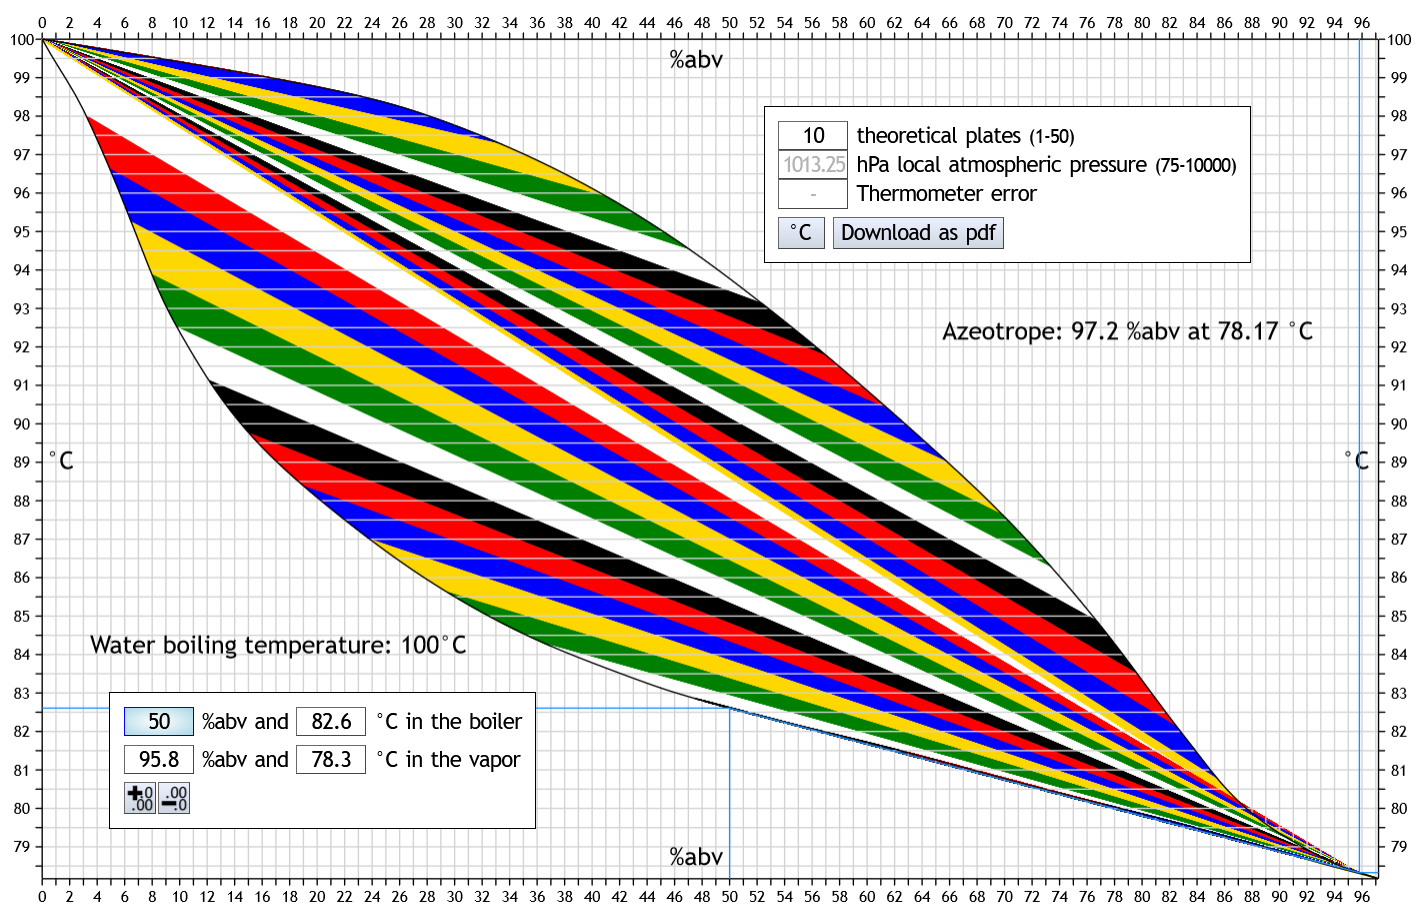 And only 0.5%abv in the boiler results in 95.3%abv in the distillate:
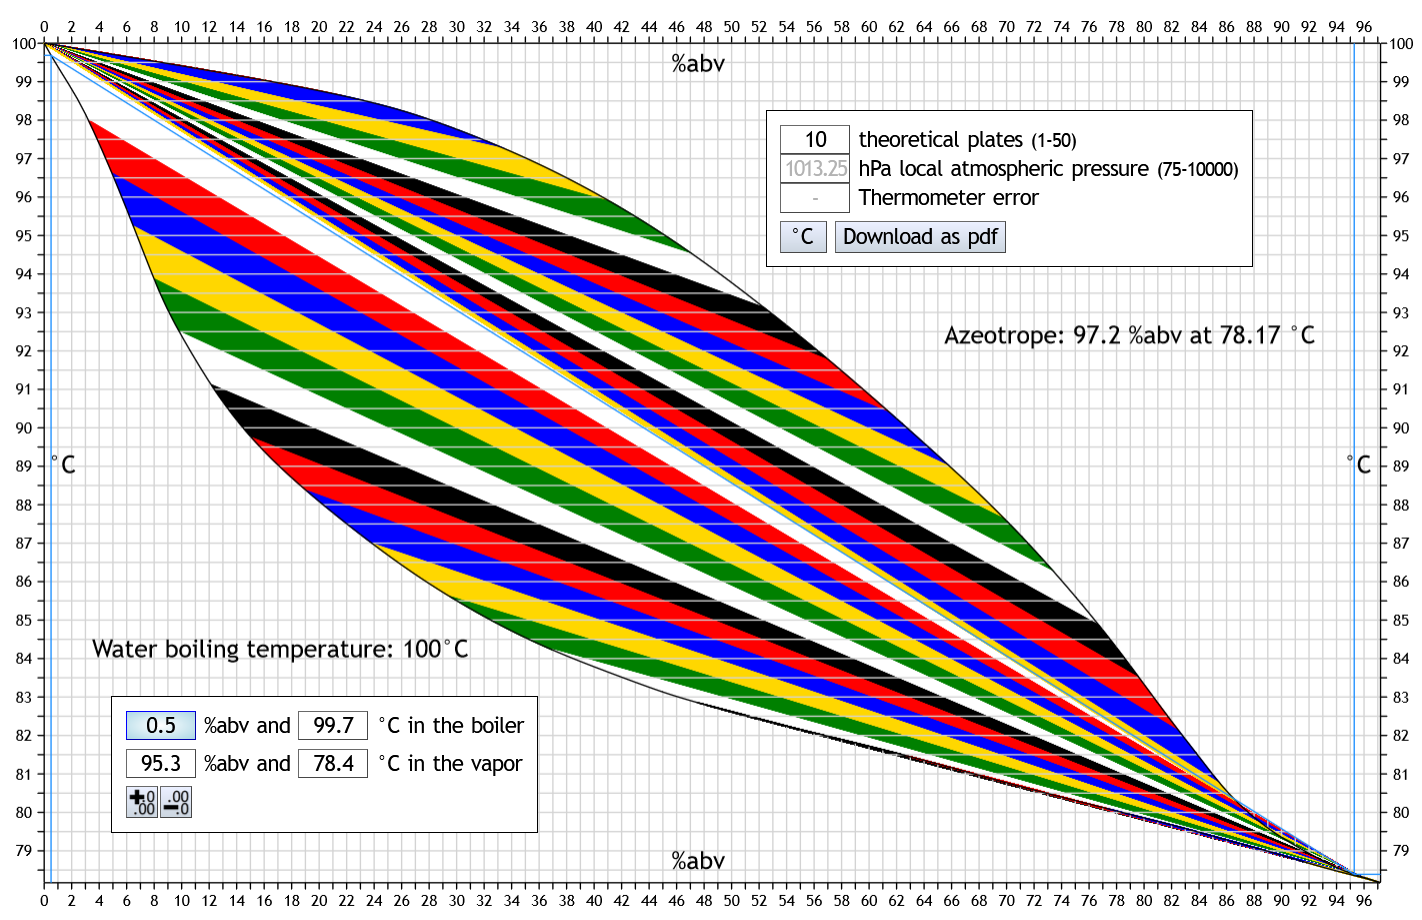 So 1/100 of the alcohol concentration in the still means only 0.5%abv less in the distillate.
So the diagram explains that in a reflux distillation, the alcohol strength stays up almost to the end.
So 1/100 of the alcohol concentration in the still means only 0.5%abv less in the distillate.
So the diagram explains that in a reflux distillation, the alcohol strength stays up almost to the end.
Even at low rectification, this is already visible in principle: For example, at 1.5 theoretical plates, i.e. a slow-running potstill with a long packed riser: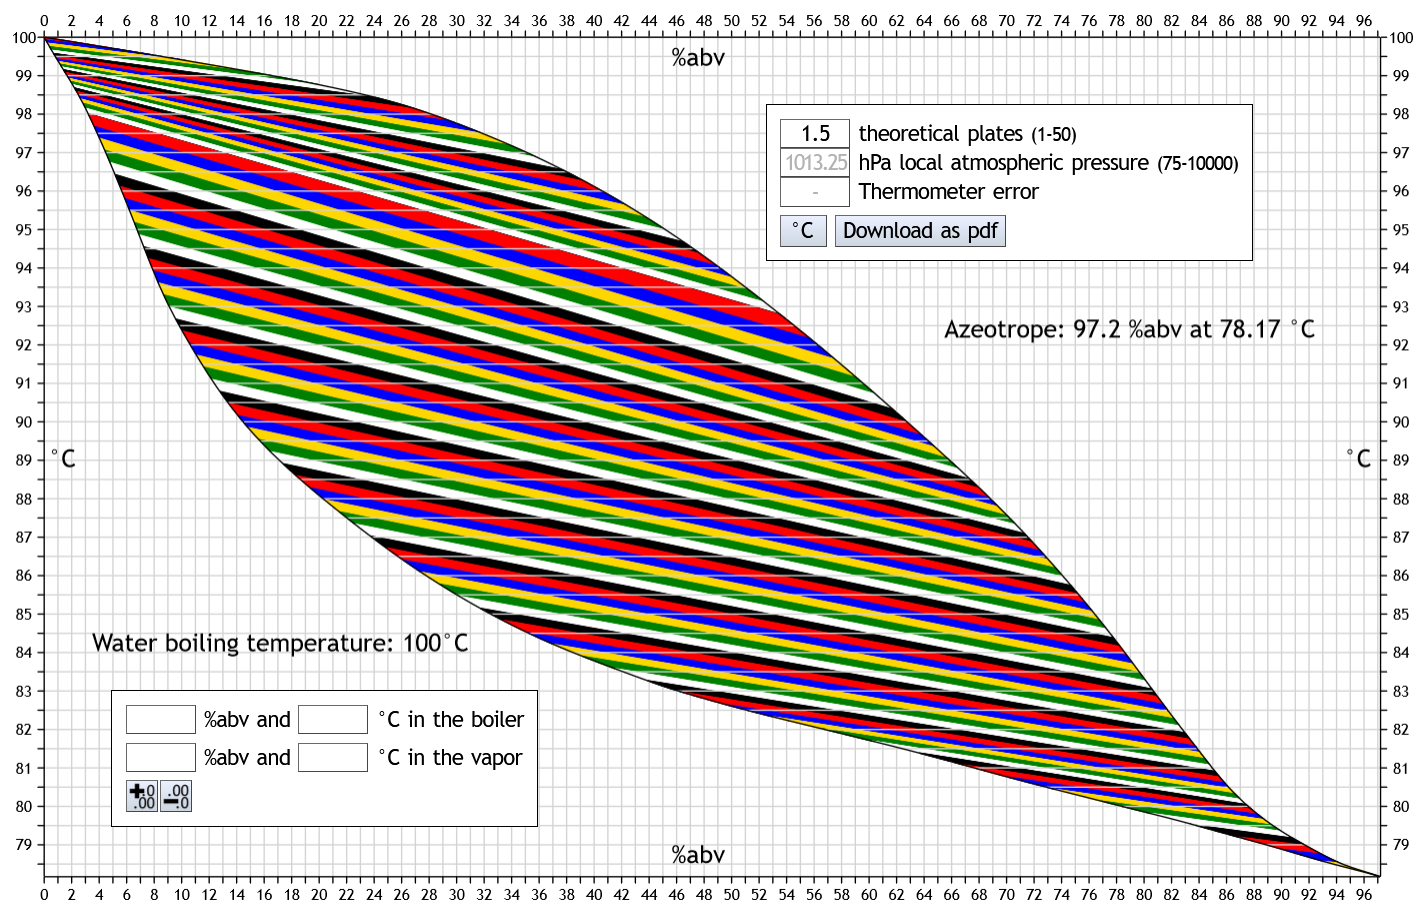 If you now start with the cursor at the bottom at 30 or 40 %abv in the boiler (i.e. as with a spirit run) and slowly move it towards 0 %abv, you can see how the two blue lines of the distillate (top right) move only a little at first and then more and more quickly.
The diagram thus represents the typical behavior of a potstill spirit run.
Namely, the alcohol strength remains stable in the upper range for quite a long time, but then drops faster and faster.
If you now start with the cursor at the bottom at 30 or 40 %abv in the boiler (i.e. as with a spirit run) and slowly move it towards 0 %abv, you can see how the two blue lines of the distillate (top right) move only a little at first and then more and more quickly.
The diagram thus represents the typical behavior of a potstill spirit run.
Namely, the alcohol strength remains stable in the upper range for quite a long time, but then drops faster and faster.
Calculable atmospheric pressures are between 75 and 10000 hPa. The consideration of the atmospheric pressure has a substantial influence on the result. If nothing is entered, the calculator assumes the local atmospheric pressure 1013.25 hPa.
Since almost no one has an absolutely accurate indicating thermometer, an additional "thermometer error" can be specified. This can be determined with the help of the calculator Thermometer Error. The temperatures calculated here are then those displayed on this thermometer, not the real ones.
Information about our boiling point data and the influence of atmospheric pressure
These blue lines are displayed when you move the cursor over one of the axis lines. The corresponding numerical values are displayed in the field at the bottom left.
It also works the other way around: If you enter a value, the other three are calculated and the corresponding blue lines are drawn.
With more than one theoretical plate, such a diagram is not usable. This is because then you get a higher alcohol strength in the distillate and the vapor temperature is lower than the boiler temperature. This calculator solves this by drawing slanted lines instead of horizontal ones between the two curves. These lines are colored only for better visibility:
A few details can be made visible very well with this calculator:
For example, that at high rectification it doesn't really matter how much alcohol you have in the boiler. At least in terms of the %abv reached in the distillate. Here are 10 theoretical plates. 50%abv in the boiler gives 95.8%abv in the distillate:
Even at low rectification, this is already visible in principle: For example, at 1.5 theoretical plates, i.e. a slow-running potstill with a long packed riser:
Calculable atmospheric pressures are between 75 and 10000 hPa. The consideration of the atmospheric pressure has a substantial influence on the result. If nothing is entered, the calculator assumes the local atmospheric pressure 1013.25 hPa.
Since almost no one has an absolutely accurate indicating thermometer, an additional "thermometer error" can be specified. This can be determined with the help of the calculator Thermometer Error. The temperatures calculated here are then those displayed on this thermometer, not the real ones.
Information about our boiling point data and the influence of atmospheric pressure